The Hidden Cost of Convenience
Here's a scenario I see repeatedly: development teams choose DynamoDB On-Demand capacity for its simplicity and "pay-per-request" model, assuming it's the most cost-effective option. Six months later, they're shocked by their AWS bill and scrambling to understand why their database costs have spiralled out of control.
💸 The Reality Check
For predictable workloads, On-Demand capacity can cost 3–4× more than Provisioned capacity. That's not a typo – we're talking about potential savings of 75% or more on your DynamoDB spend.
The challenge is that AWS pricing can be complex to navigate, and the true cost difference isn't immediately obvious. That's why I built the DynamoDB Cost Comparator – a production-ready tool that makes these calculations transparent and actionable.
🎯 What You'll Learn
- • Understanding DynamoDB capacity modes and their differences
- • When Provisioned capacity makes sense for your workloads
- • How to deploy and use the cost comparator tool
- • Real-world application scenarios and implementation examples
- • Cost optimisation best practices and operational strategies
Understanding DynamoDB Capacity Modes
DynamoDB offers two fundamentally different approaches to capacity management, each optimised for different use cases and cost profiles.
On-Demand Capacity
- • Automatically scales with traffic
- • Pay per request (read/write)
- • No capacity planning required
- • Ideal for unpredictable workloads
- • Higher cost per operation
Provisioned Capacity
- • Fixed read/write capacity units
- • Pay for provisioned throughput
- • Requires capacity planning
- • Optional auto-scaling available
- • Significantly lower cost per operation
Real Cost Comparison: Sydney Region
Let's examine a typical workload: 100 reads per second and 50 writes per second in the Asia Pacific (Sydney) region:
| Capacity Mode | Monthly Cost (USD) | Cost Difference |
|---|---|---|
| Provisioned Capacity | $36.67 | Baseline |
| On-Demand Capacity | $112.01 | 3.05× more expensive |
💡 Insight: This represents potential annual savings of $904.08 USD for just one table with moderate traffic. Scale this across multiple tables and environments, and the savings become substantial.
When Provisioned Capacity Makes Sense
The key to maximising DynamoDB cost efficiency lies in understanding your workload patterns. Provisioned capacity shines in scenarios where traffic is predictable and consistent.
Internal Business Applications
Applications with consistent usage patterns during business hours. Think employee management systems, internal dashboards, or CRM platforms where traffic follows predictable patterns.
⚙️ Implementation Detail: Use auto-scaling to handle gradual increases during peak business hours while maintaining cost predictability.
Scheduled and Batch Processing
ETL jobs, data synchronisation tasks, and scheduled reports that run at known intervals with predictable resource requirements.
🧠 Insight: You can even schedule capacity changes using AWS Application Auto Scaling to match your batch processing windows.
Steady-State Production Workloads
Mature applications with established user bases where traffic patterns are well‑understood and growth is gradual rather than explosive.
💡 Tip: Monitor CloudWatch metrics for 2‑4 weeks to establish baseline capacity requirements before switching from On-Demand.
Auto-Scaling: Best of Both Worlds
Provisioned capacity doesn't mean static capacity. Auto-scaling allows you to maintain cost efficiency while adapting to gradual demand changes. Set target utilisation between 70‑80% to balance cost and performance, with scaling policies that respond to sustained load changes rather than brief spikes.
Introducing the DynamoDB Cost Comparator
Calculating DynamoDB costs manually is time-consuming and error‑prone. The AWS Pricing Calculator, while comprehensive, can be overwhelming for quick comparisons. That's why I built a focused tool that answers one specific question: "How much will I save with Provisioned capacity for my workload?"
Tool Capabilities
Core Features
- • Real-time cost comparison across all AWS regions
- • Supports custom read/write throughput requirements
- • Excludes storage costs for focused capacity analysis
- • Mobile‑responsive design for on‑the‑go calculations
Technical Implementation
- • Serverless architecture with AWS Lambda
- • CloudFront CDN for global performance
- • Comprehensive input validation and security
- • Production‑ready with monitoring and logging
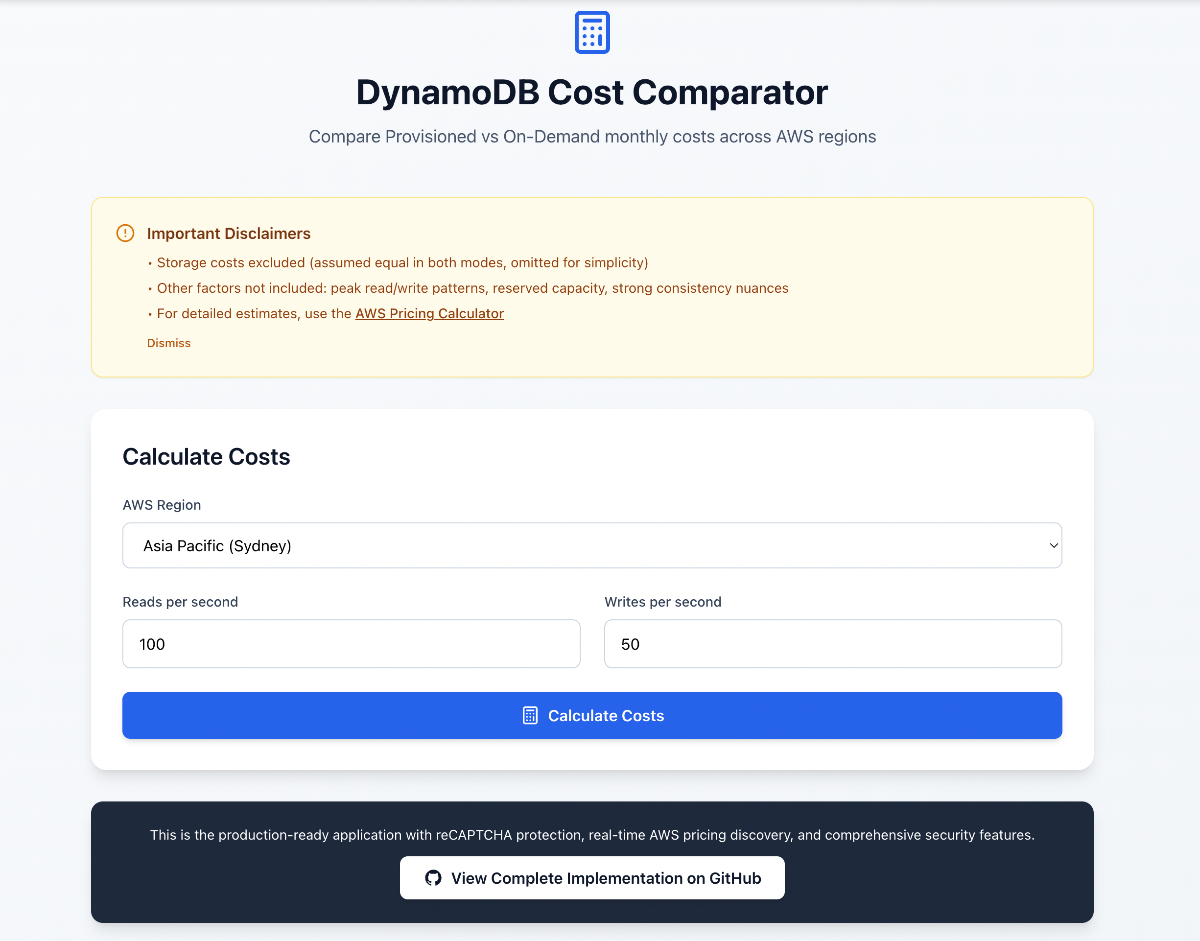
Application Interface
The following screenshot demonstrates the DynamoDB Cost Comparator interface, showing how the application calculates and compares costs across different DynamoDB configurations with sample data and realistic usage patterns.
Cost Comparison Interface
Architecture Overview
The cost comparator demonstrates modern serverless architecture patterns while maintaining security and performance best practices. Built with React 18 + TypeScript frontend and Python 3.12 Lambda backend, it showcases production‑ready AWS patterns.
System Architecture

Frontend Layer
React 18 + TypeScript application with Tailwind CSS styling, featuring Google reCAPTCHA v3 bot protection and responsive design optimized for global CDN delivery.
Backend Layer
Python 3.12 Lambda functions behind API Gateway with comprehensive input validation, real‑time AWS Pricing API integration, and intelligent caching for performance optimization.
Security & Observability
CloudFront + WAF security layer with rate limiting and bot mitigation, plus comprehensive CloudWatch observability dashboard tracking API metrics, Lambda insights, and user analytics.
Production‑Ready Features
- • CloudFront CDN with global edge locations
- • WAF protection with static assets caching
- • Google reCAPTCHA v3 bot protection
- • Real‑time pricing discovery across AWS regions
- • CloudWatch observability with custom metrics
- • API Gateway with CORS and request validation
- • Python Lambda with comprehensive error handling
- • Infrastructure as Code with AWS CloudFormation
Try It Yourself: Quick Deployment
Prerequisites:
- • AWS CLI configured with appropriate permissions
- • Node.js 18+ and npm installed
- • Basic understanding of DynamoDB concepts
Step 1Clone and Setup
git clone https://github.com/akhilkakar/dynamodb-cost-comparator
cd dynamodb-cost-comparator
npm install
Step 2Deploy Infrastructure
chmod +x deploy.sh
./deploy.sh
The deployment script will create the necessary AWS resources and deploy the application.
Step 3Access the Application
After deployment, the script will output the application URL. Open it in your browser to start analysing DynamoDB costs.
Cleanup Resources
When you're finished testing, clean up the AWS resources to avoid ongoing charges:
./cleanup.shReal-World Applications
Understanding when and how to apply DynamoDB cost optimisation strategies can significantly impact your AWS bill. Here are practical scenarios where these techniques deliver measurable results.
E-commerce Platforms
Product catalogues with seasonal traffic patterns benefit from on-demand billing during peak periods and provisioned capacity for baseline traffic.
Savings: Up to 40% cost reduction by switching between billing modes based on traffic patterns.
Analytics Workloads
Time-series data and analytics tables often have predictable access patterns, making them ideal candidates for provisioned capacity with auto-scaling.
Optimisation: Partition key design and GSI strategies can reduce costs by 60%.
Gaming Applications
Player data and leaderboards require consistent low-latency access with unpredictable traffic spikes during events or launches.
Strategy: Hybrid approach with base provisioned capacity and on-demand bursting.
Mobile Applications
User profiles and session data with global distribution requirements benefit from Global Tables with regional cost optimisation.
Approach: Regional capacity planning and data lifecycle management.
Cost Optimisation Decision Framework
Predictable Traffic: Use provisioned capacity with auto-scaling for consistent, predictable workloads to achieve up to 75% cost savings compared to on-demand.
Unpredictable Spikes: On-demand billing eliminates over-provisioning costs and provides automatic scaling without capacity planning.
Mixed Patterns: Consider table-level billing mode switching or separate tables for different access patterns to optimise costs across your entire application.
Cost Optimisation Best Practices
Implementing these proven strategies can dramatically reduce your DynamoDB costs while maintaining or improving performance. Each practice addresses specific cost drivers and provides measurable optimisation opportunities.
Table Design Optimisation
Partition Key Strategy
- • Use high-cardinality partition keys to distribute load evenly
- • Avoid hot partitions that consume excessive capacity
- • Consider composite keys for better distribution
- • Monitor partition metrics with CloudWatch
Attribute Optimisation
- • Minimise item sizes to reduce storage and throughput costs
- • Use sparse indexes for optional attributes
- • Compress large text fields before storage
- • Remove unused attributes and indexes
Capacity Management
Auto-Scaling Configuration
- • Set appropriate target utilisation (70-80%)
- • Configure minimum and maximum capacity limits
- • Use different scaling policies for reads vs writes
- • Monitor scaling events and adjust thresholds
Reserved Capacity Planning
- • Analyse usage patterns over 4-6 weeks
- • Purchase reserved capacity for baseline usage
- • Maintain on-demand capacity for spikes
- • Review and adjust reservations quarterly
Monitoring and Analytics
CloudWatch Metrics
- • Monitor ConsumedReadCapacityUnits and ConsumedWriteCapacityUnits
- • Set alarms for throttled requests (ThrottledRequests)
- • Track successful request latency for performance baselines
- • Use custom dashboards for capacity planning visibility
Cost Analysis Tools
- • Regular AWS Cost Explorer analysis for DynamoDB spend
- • Tag resources for detailed cost allocation tracking
- • Set budget alerts for unexpected capacity usage
- • Review and export billing data monthly
Next Steps
DynamoDB cost optimisation is an ongoing process that requires continuous monitoring and adjustment as your application grows. Start with small, measurable changes and scale your optimisation efforts based on results.
Start with Analysis
Begin by analysing your current DynamoDB usage patterns using CloudWatch metrics. Identify tables with consistent traffic that could benefit from provisioned capacity.
Use the Cost Comparator Tool
Evaluate potential savings using the interactive cost comparator tool. Export results for team alignment and executive buy-in for infrastructure changes.
Ready to Optimise Your DynamoDB Costs?
Let's discuss how I can help optimize your DynamoDB infrastructure and reduce your AWS costs.